|
NOAA Advisories Map - Click for DETAIL!
|
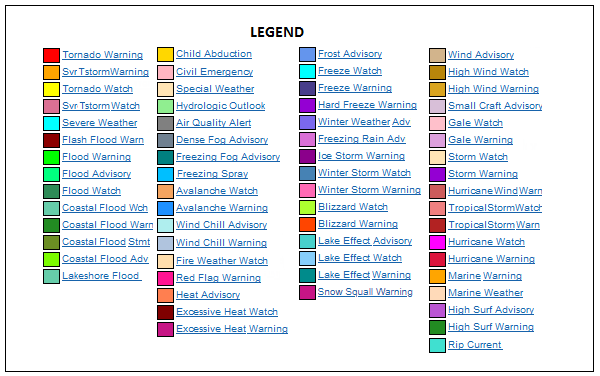
Legend
|
 |
 |
Top of Page |
|
|
|
West Infared Satellite
|
East Infared Satellite
|
|
 |
 |
Top of Page |
|
|
|
West Vapor Satellite
|
East Vapor Satellite
|
|
 |
 |
Top of Page |
|
|
|
Visible
|
GeoColor
|
|
 |
 |
Top of Page |
|
|
|
Water Vapor
|
Infrared
|
|
 |
 |
Top of Page |
|
|
|
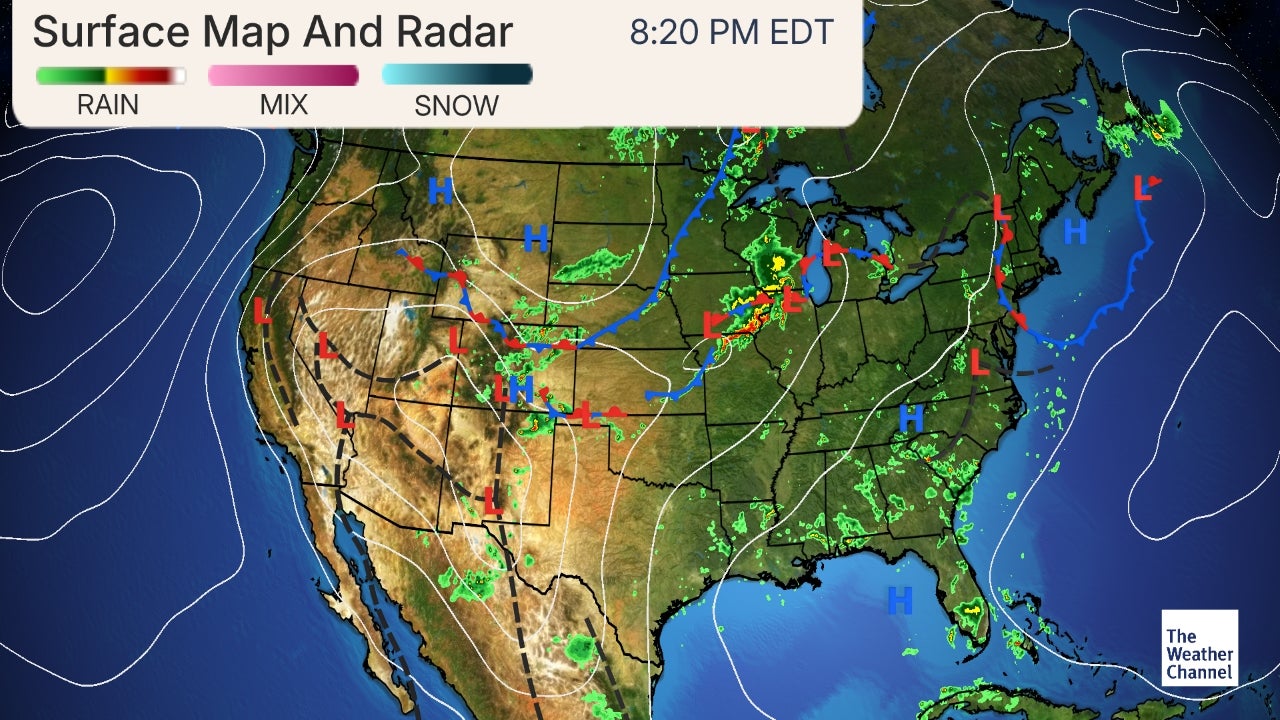
US Surface Map
|
Radar Loop
|
|
 |
 |
Top of Page |
|
|
|
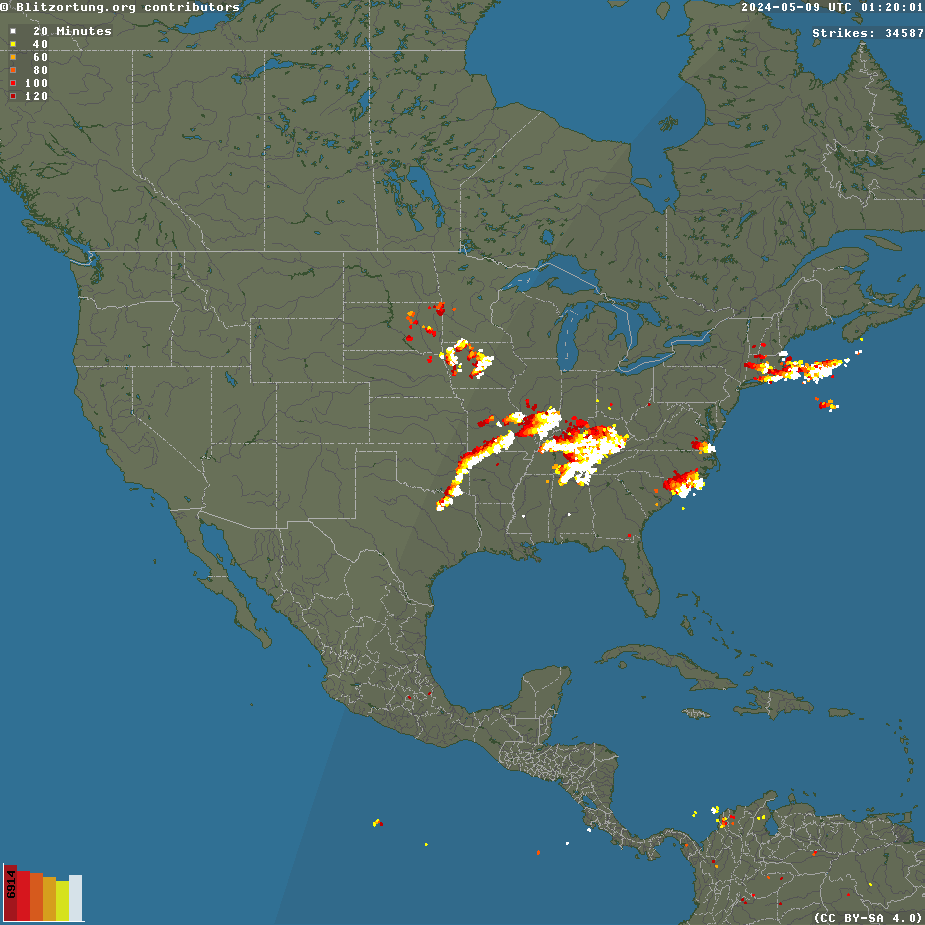
North America Lightning
|
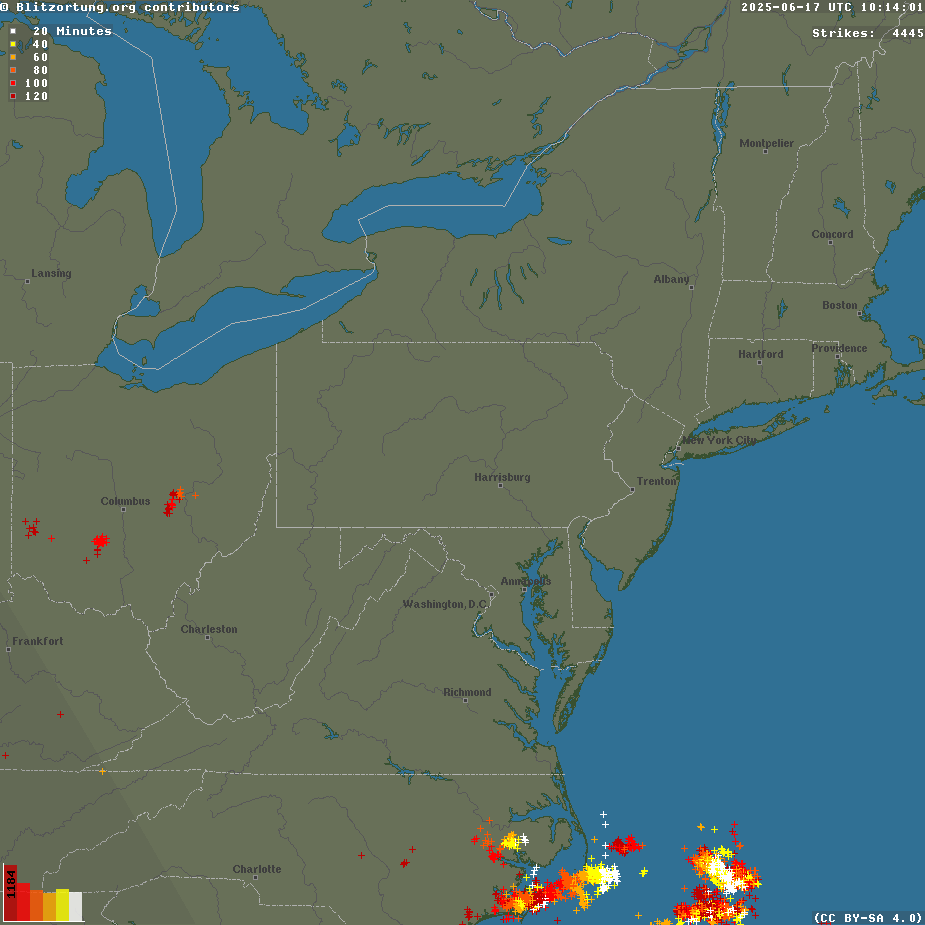
North East Lightning
|
|
 |
 |
Top of Page |
|
|
|
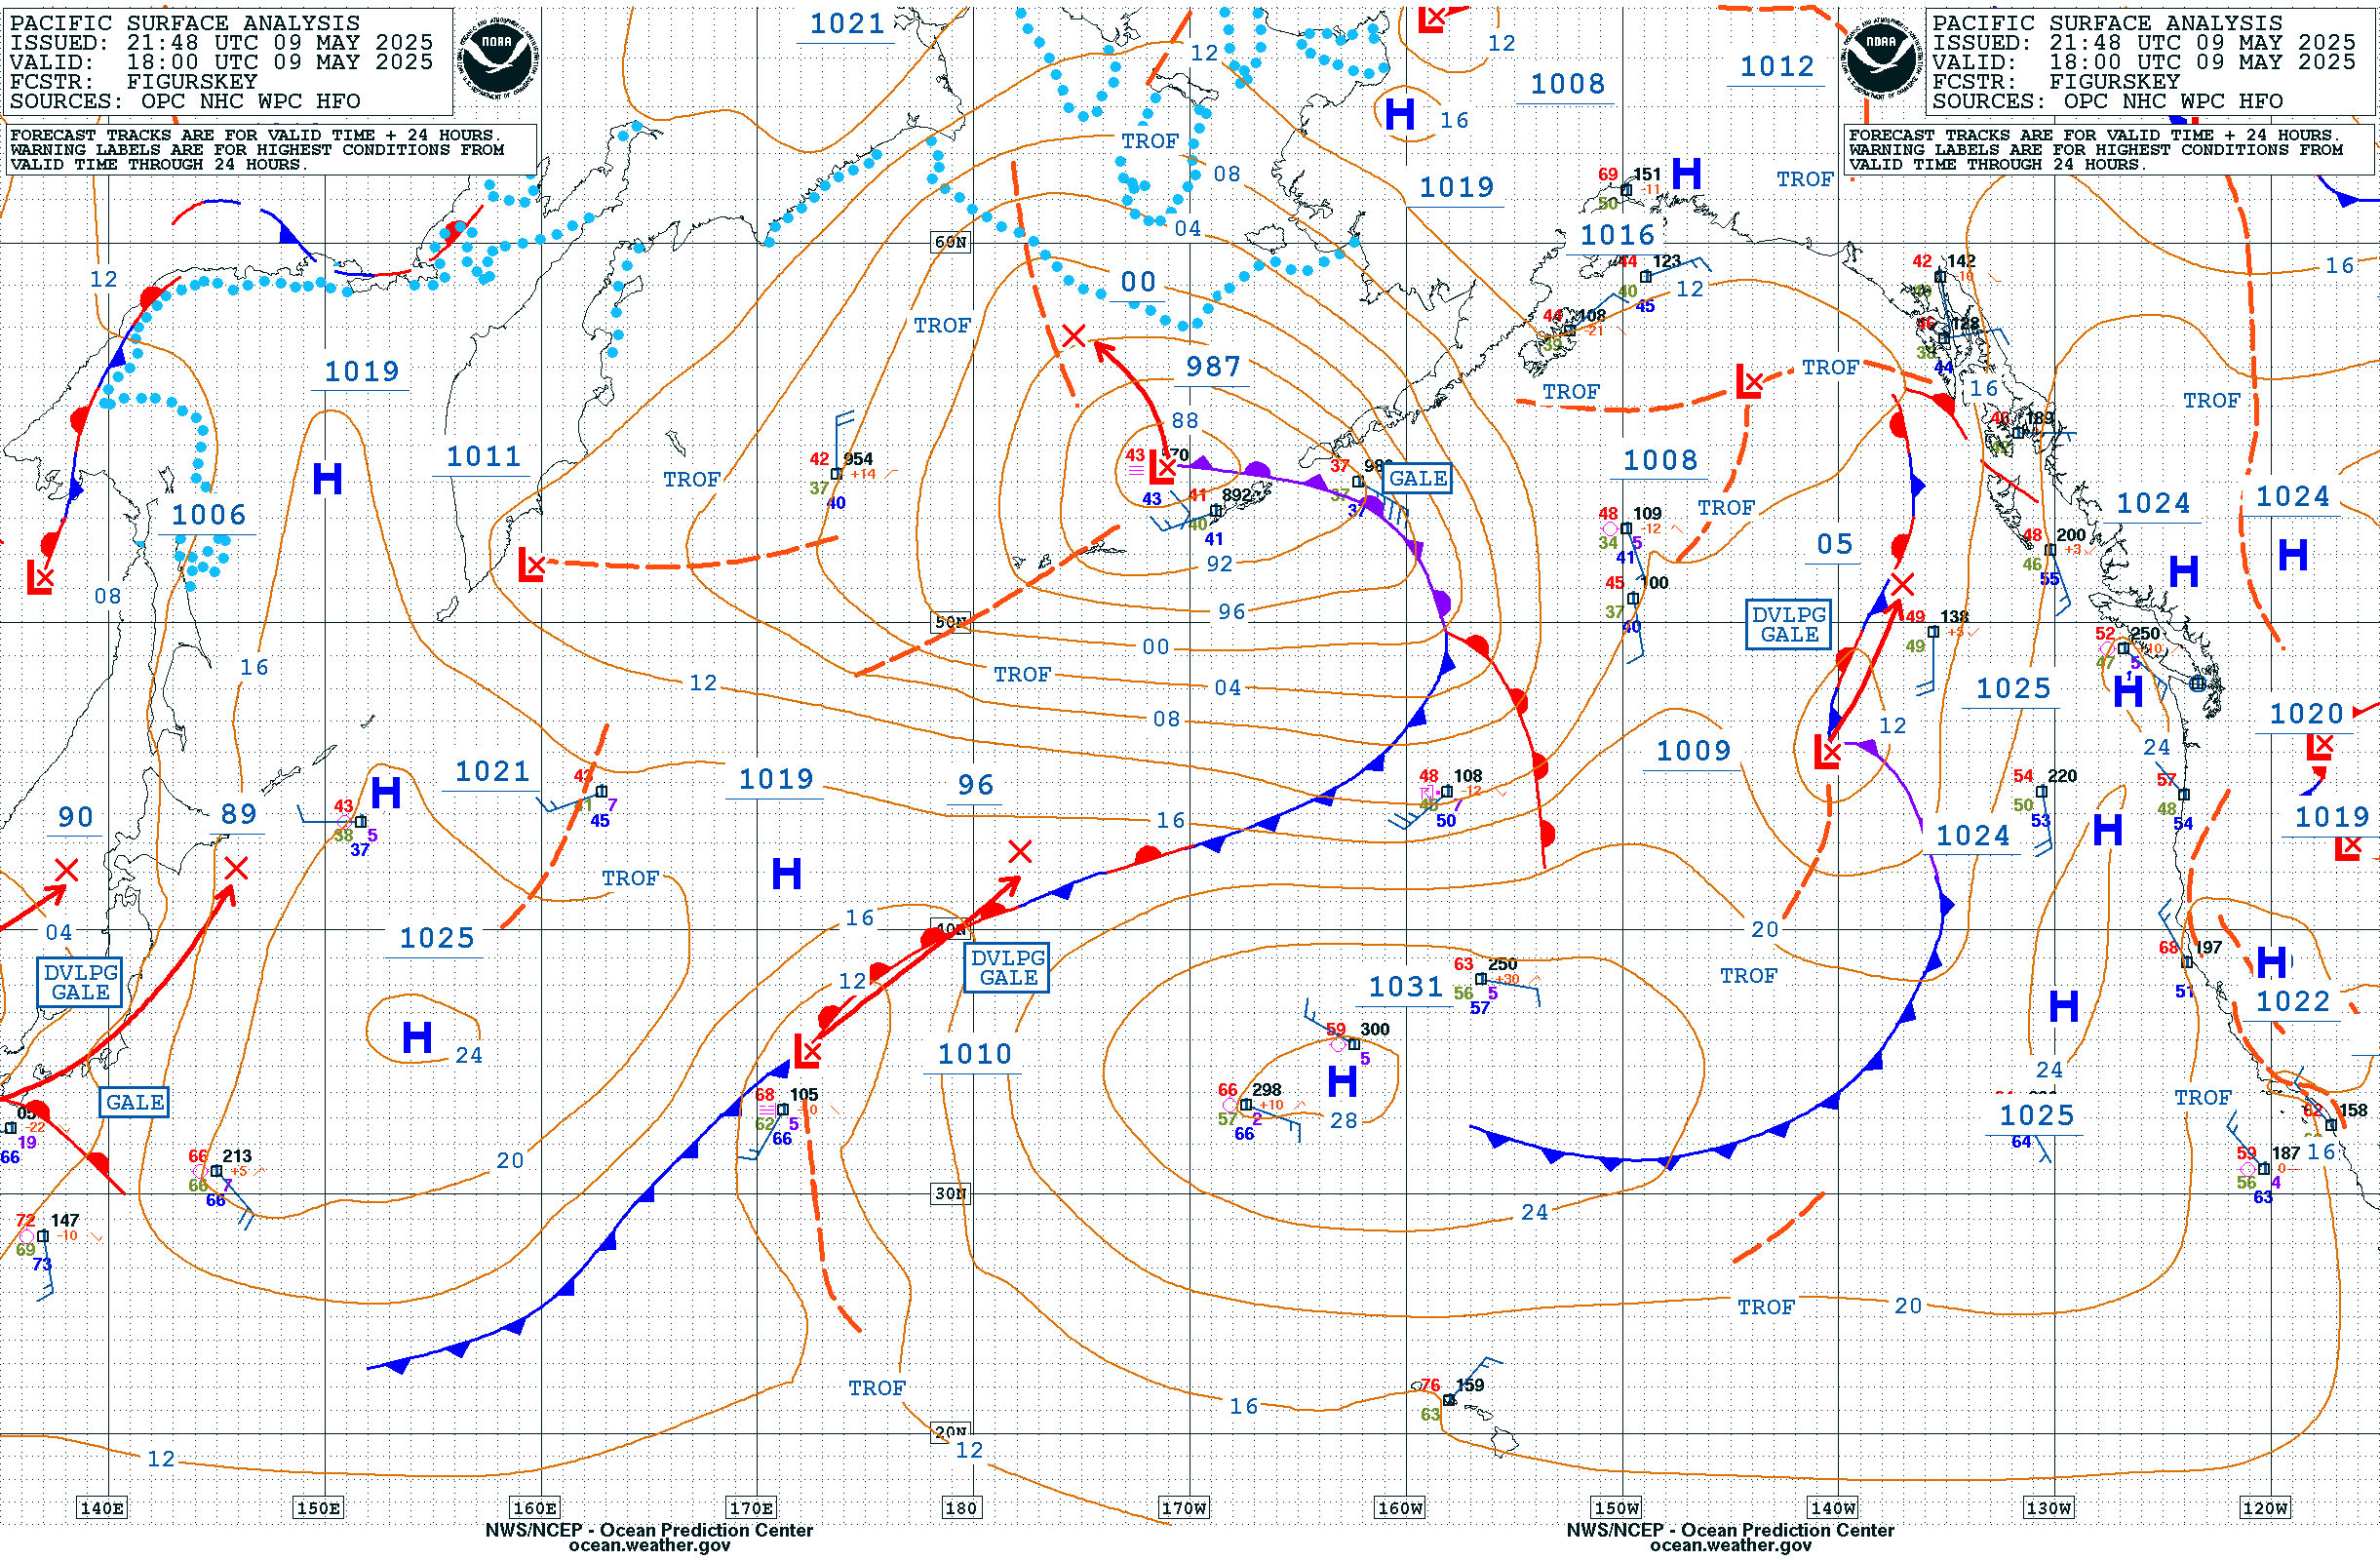
Pacific Surface Map
|
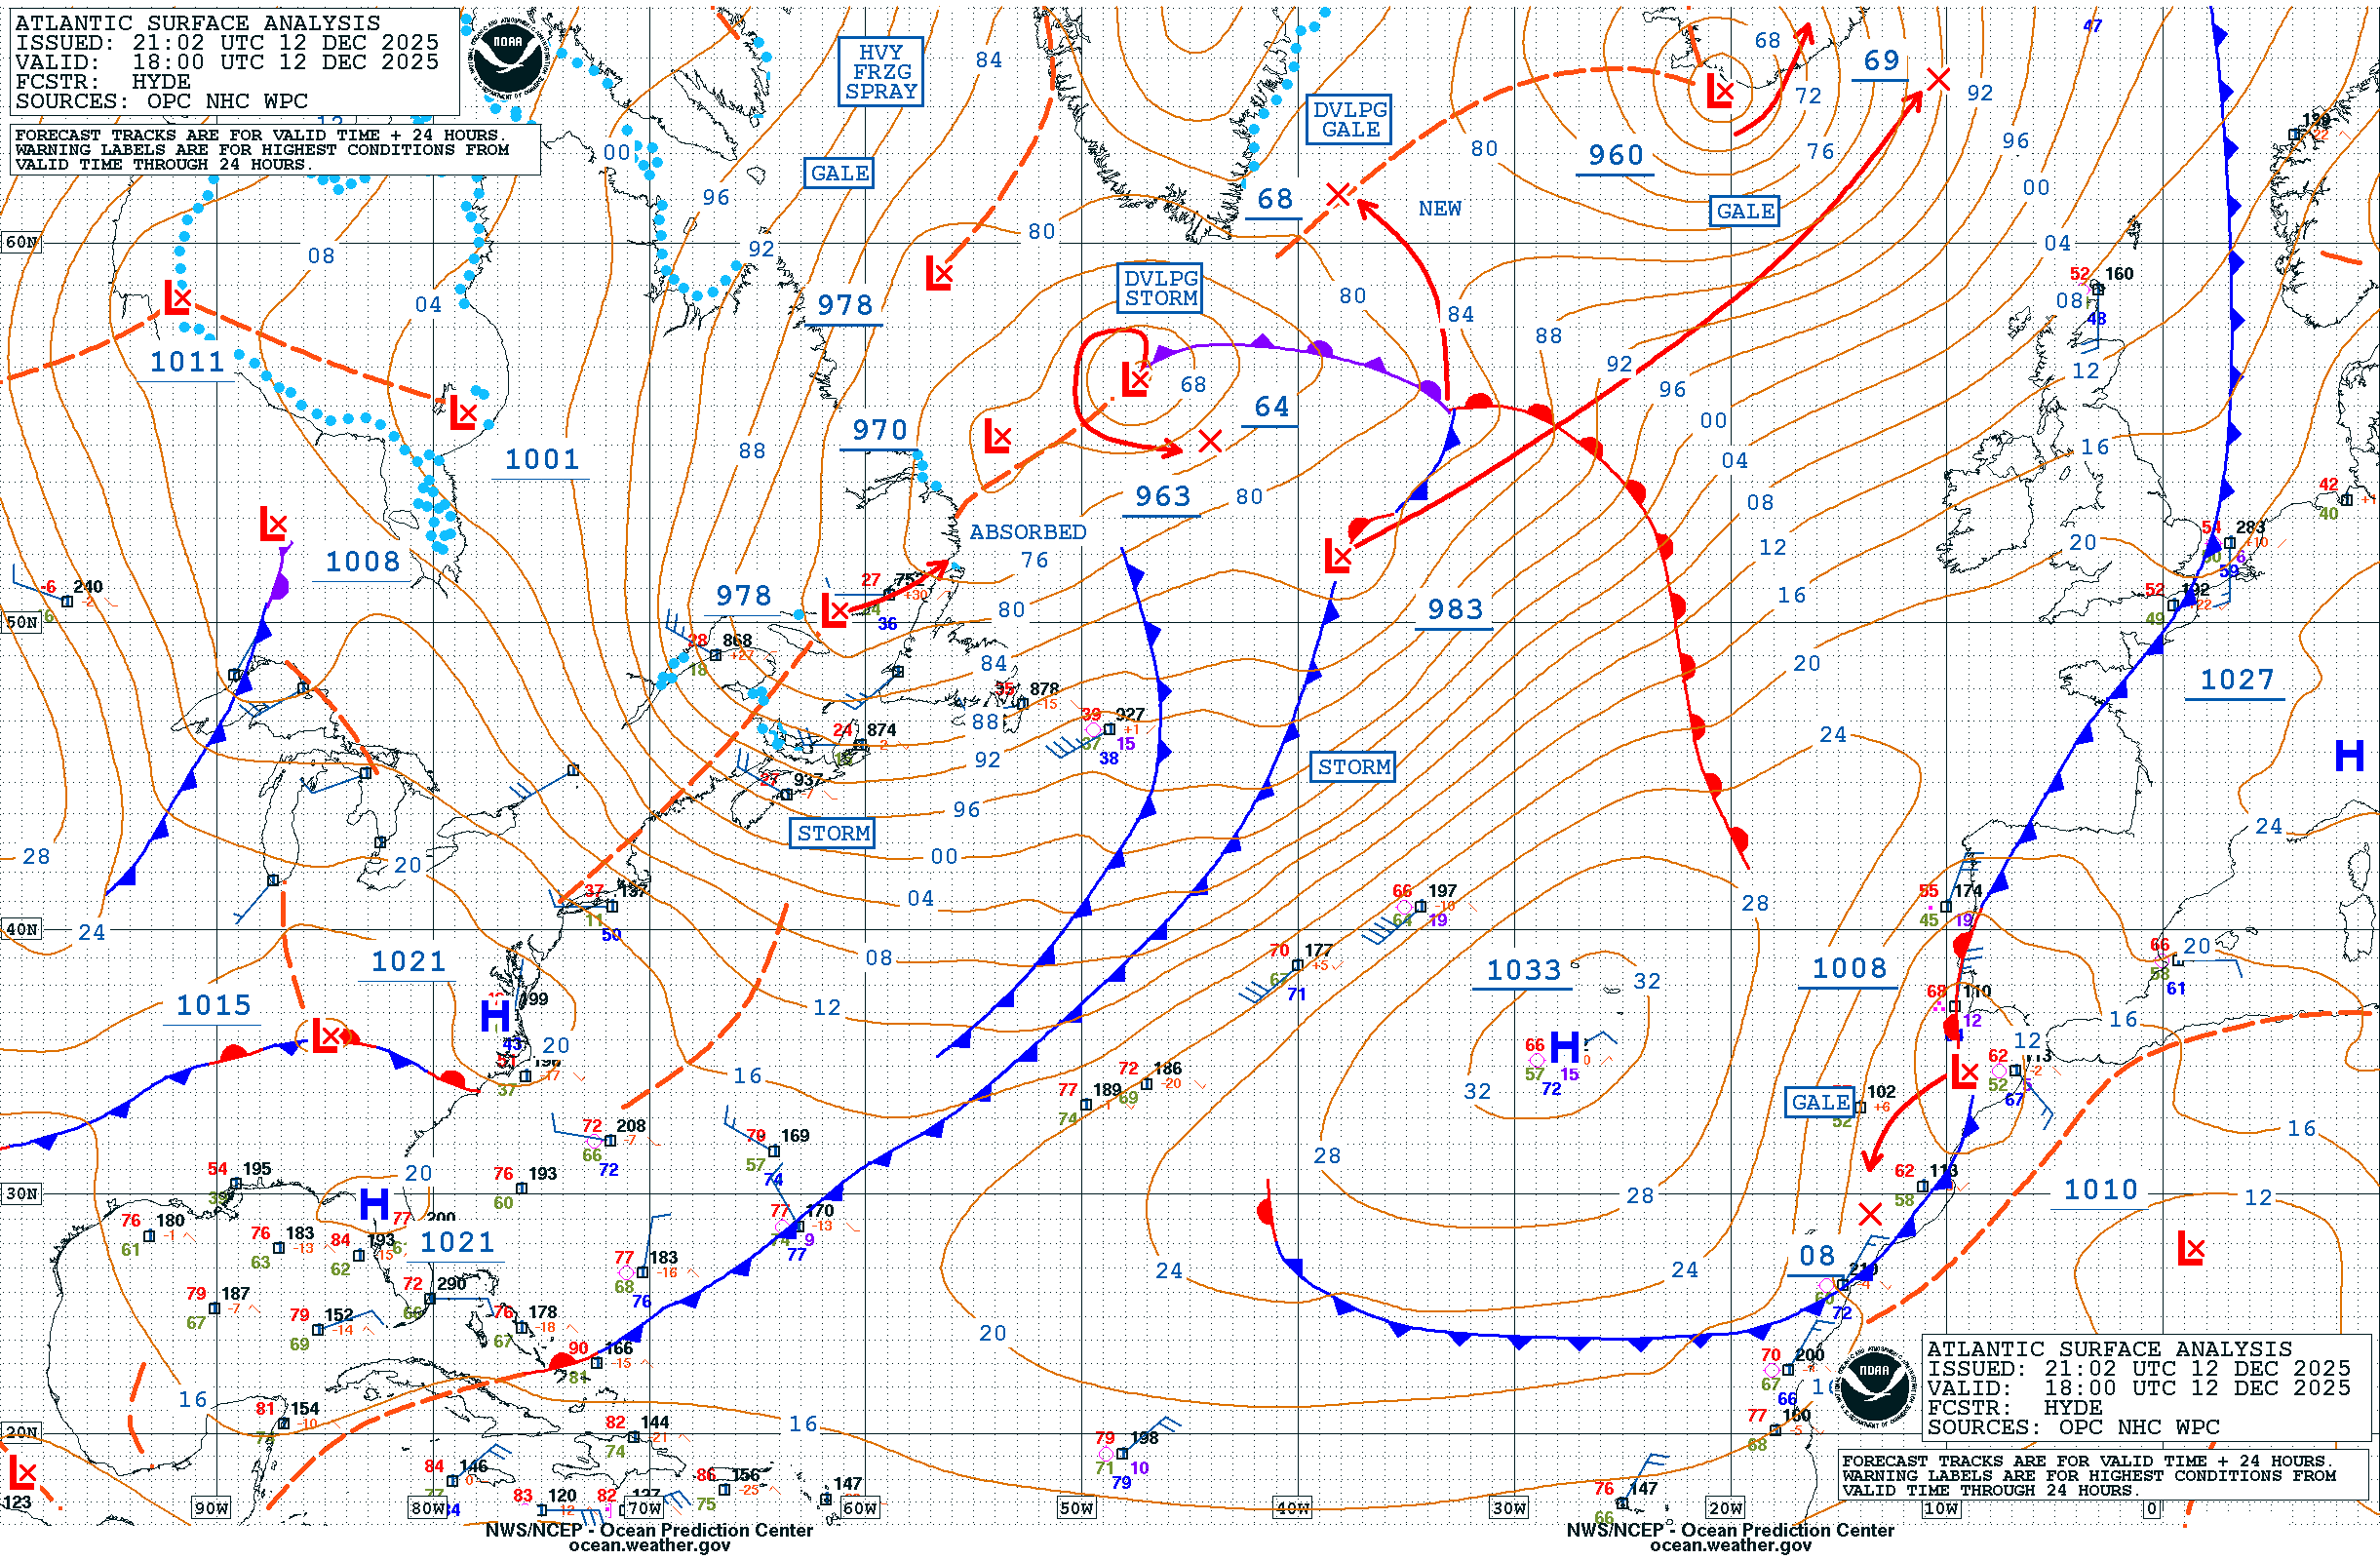
Atlantic Surface Map
|
|
 |
 |
Top of Page |
|
|
|
North America Temperature
|
North America Dewpoint
|
|
 |
 |
Top of Page |
|
|
|
United States Temperature
|
United States Feels Like
|
|
 |
 |
Top of Page |
|
|
|
6hr Temperature Change
|
24hr Temperature Change
|
|
 |
 |
Top of Page |
|
|
|
6hr 850MB Temperature Change
|
24hr 850MB Temperature Change
|
|
 |
 |
Top of Page |
|
|
|
Dewpoint
|
Humidity
|
|
 |
 |
Top of Page |
|
|
|
24hr Dewpoint Change
|
24hr Relative Humidity Change
|
|
 |
 |
Top of Page |
|
|
|
Wind Chill
|
Heat Index
|
|
 |
 |
Top of Page |
|
|
|
7 Day Temperature Trend
|
30 Day Temperature Trend
|
|
 |
 |
Top of Page |
|
|
|
7 Day Precipitation Trend
|
30 Day Precipitation Trend
|
|
 |
 |
Top of Page |
|
|
|
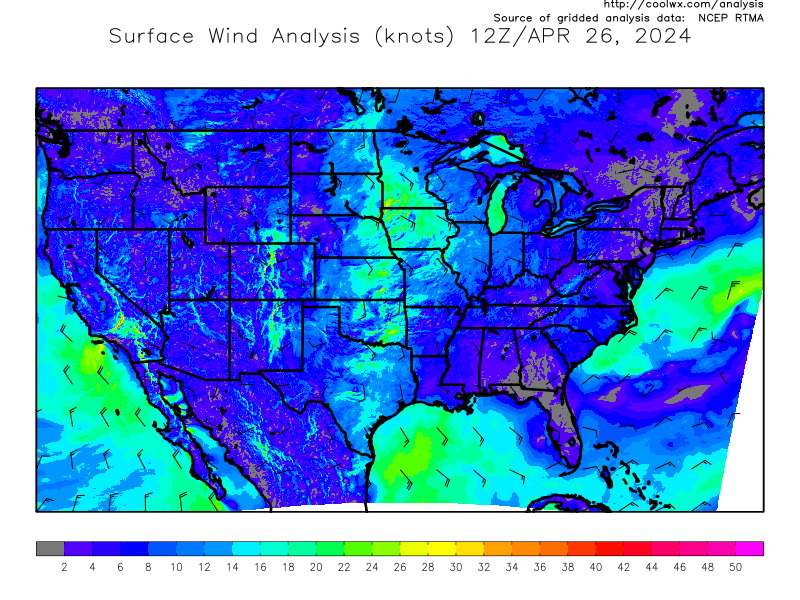
Wind Knots
|
Wind MPH
|
|
 |
 |
Top of Page |
|
|
|
Wind Max Sustained 24hr
|
Wind Max Gusting 24hr
|
|
 |
 |
Top of Page |
|
|
|
30mb Stratosphere
|
150mb Troposphere
|
|
 |
 |
Top of Page |
|
|
|
Stratosphere
|
Troposphere
|
|
 |
 |
Top of Page |
|
|
|
Western 300mb
|
Eastern 300mb
|
|
 |
 |
Top of Page |
|
|
|
Western 500MB Vorticity
|
Eastern 500MB Vorticity
|
|
 |
 |
Top of Page |
|
|
|
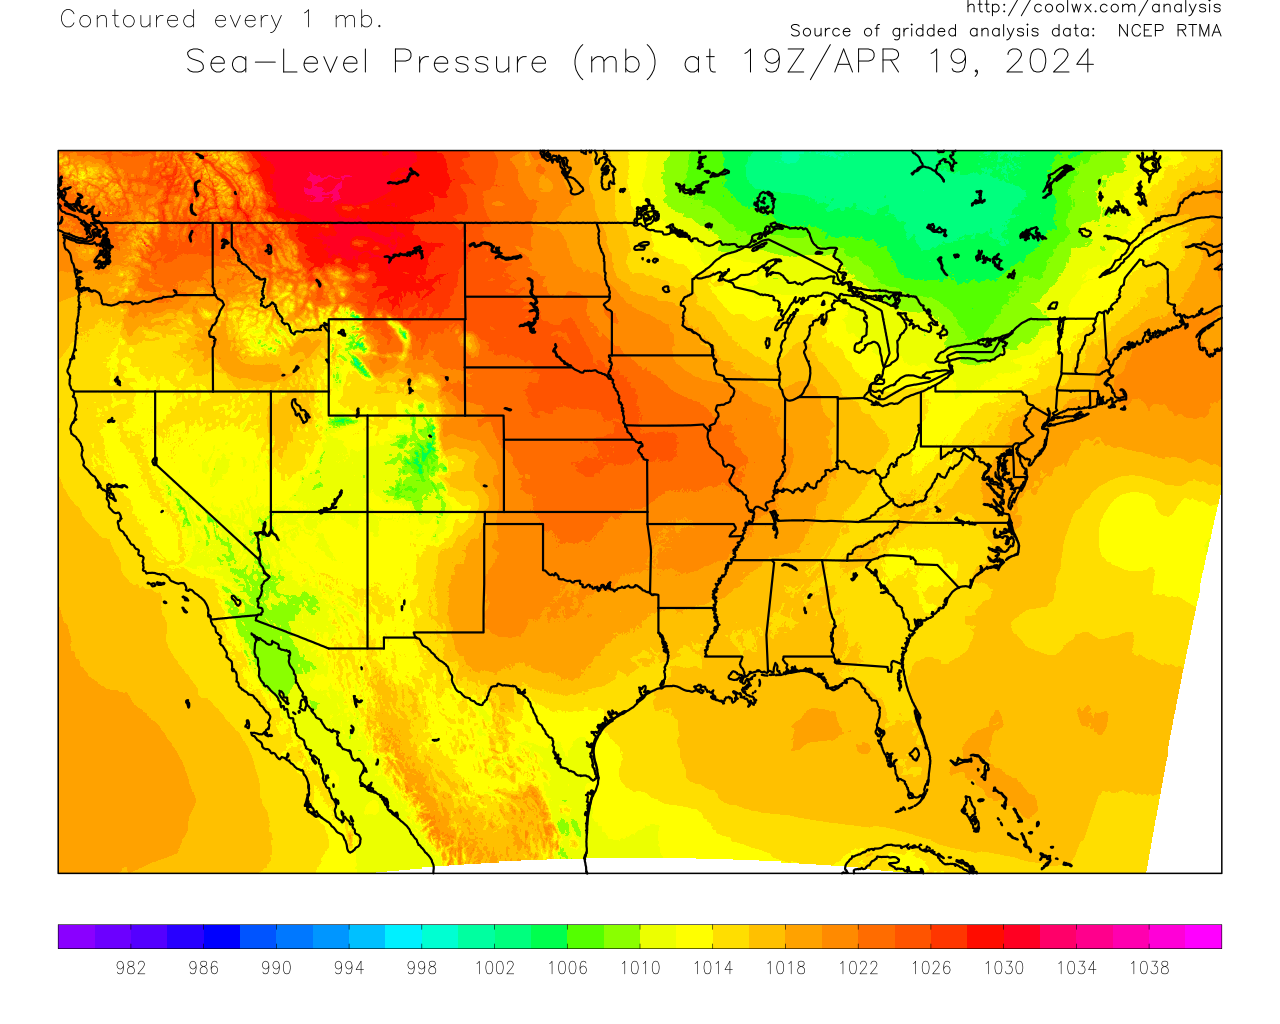
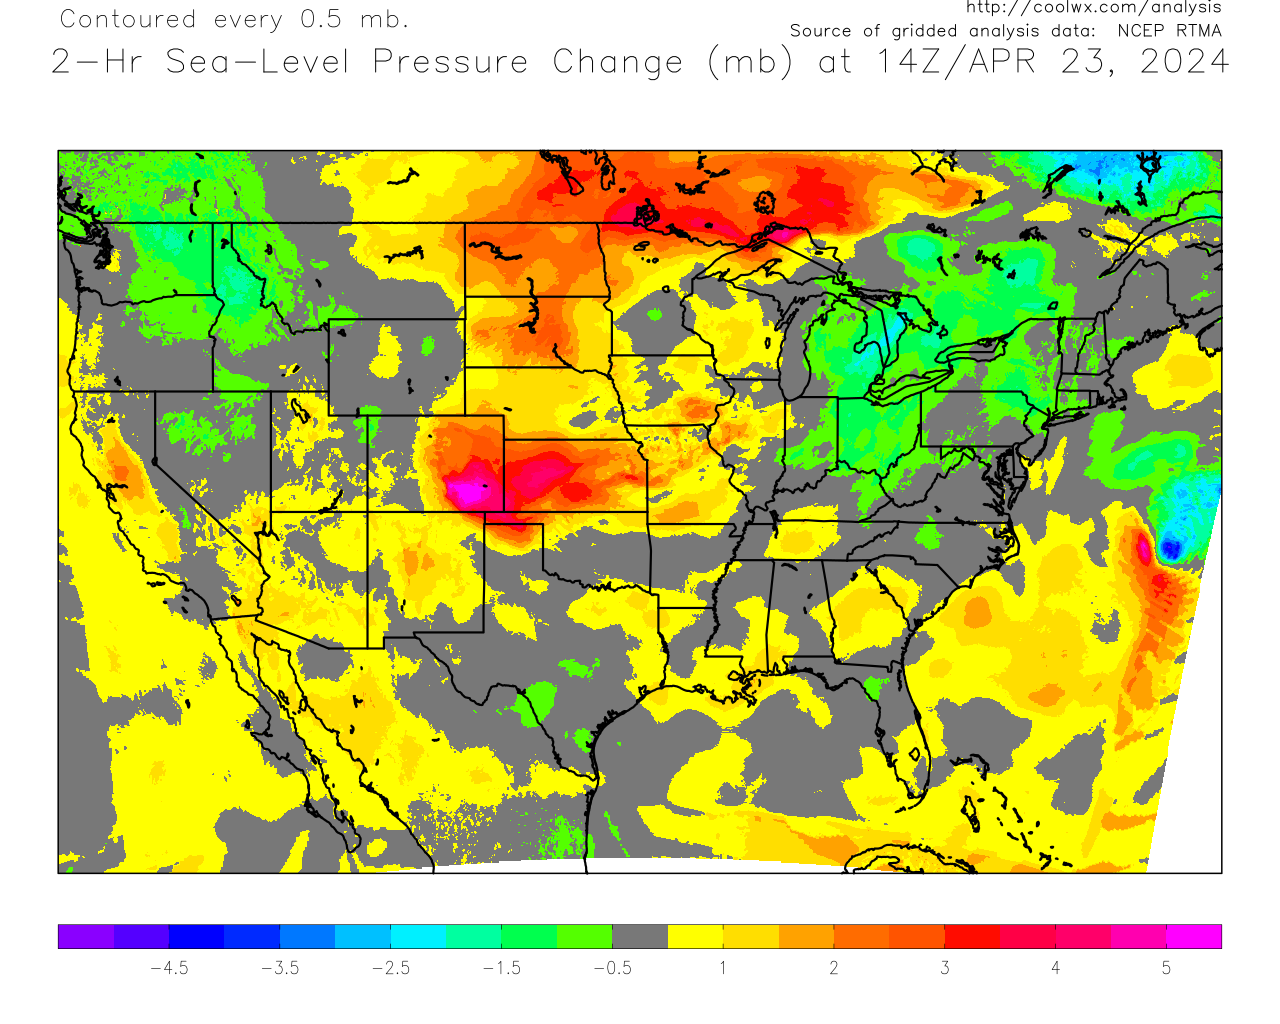
Pressure
|
2 Hour Tendency
|
|
 |
 |
Top of Page |
|
|
|
Pressure Tendency 6 Hour
|
Pressure Tendency 24 Hour
|
|
 |
 |
Top of Page |
|
|