|
Winter Information Graphics A collection of winter analog information and data. Winter Is Coming 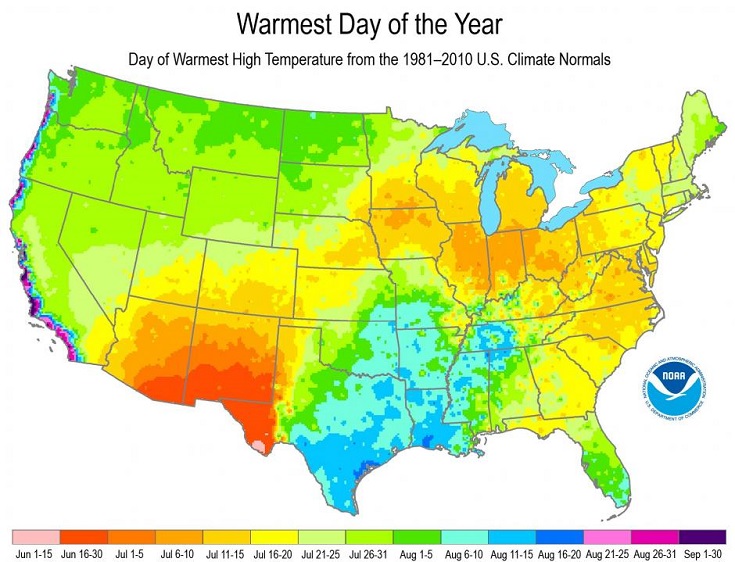
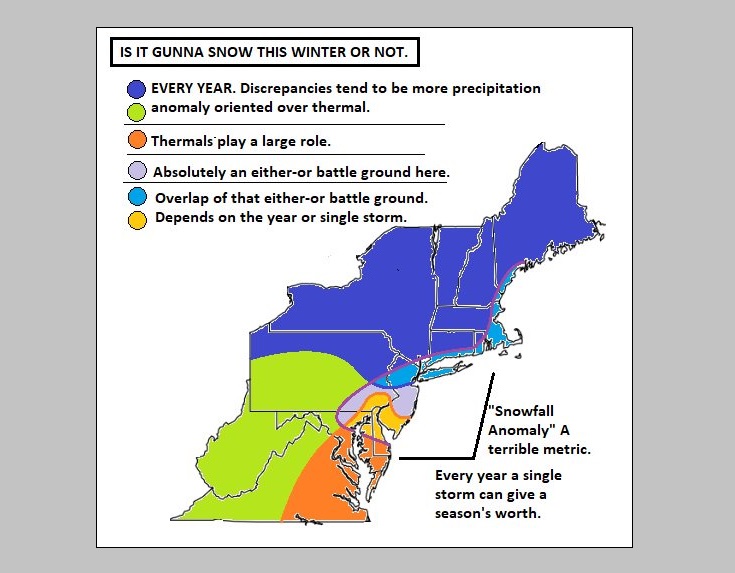
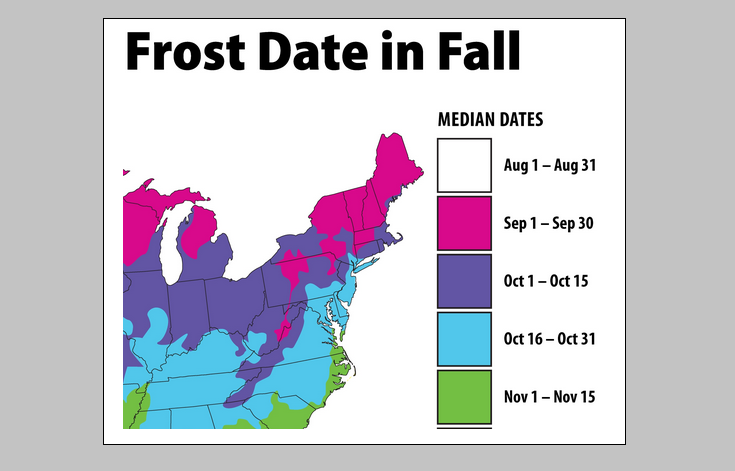
First Frost / Freeze 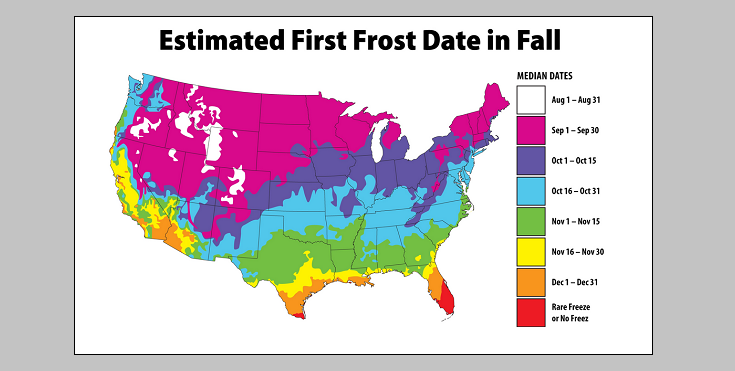
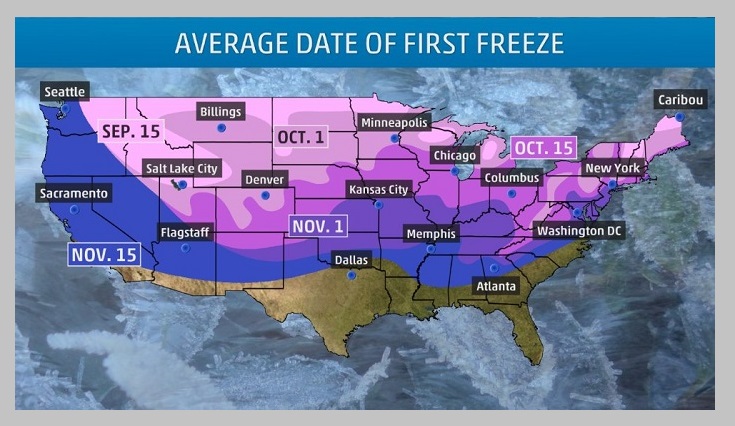
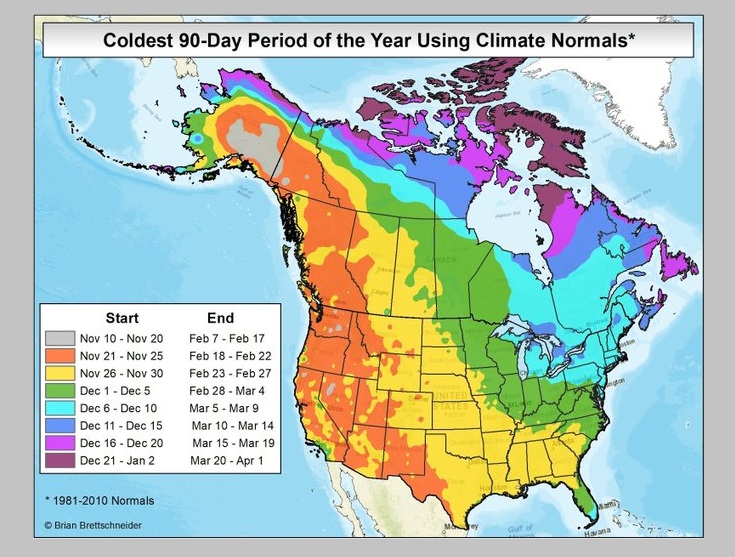
Coldest Day 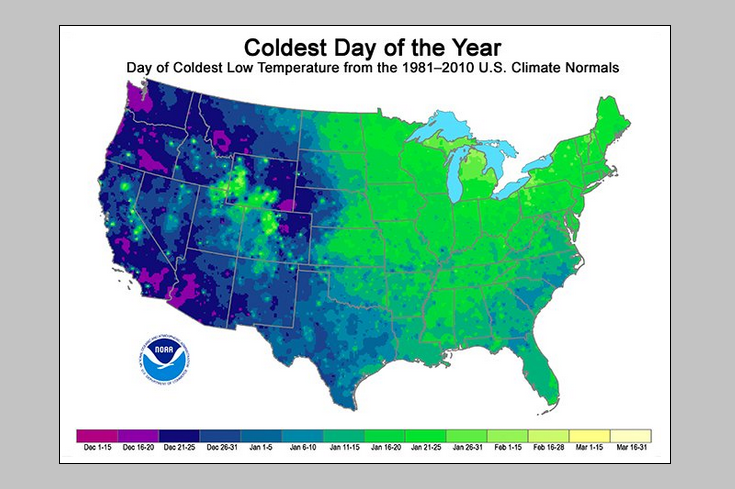
Last Frost / Freeze 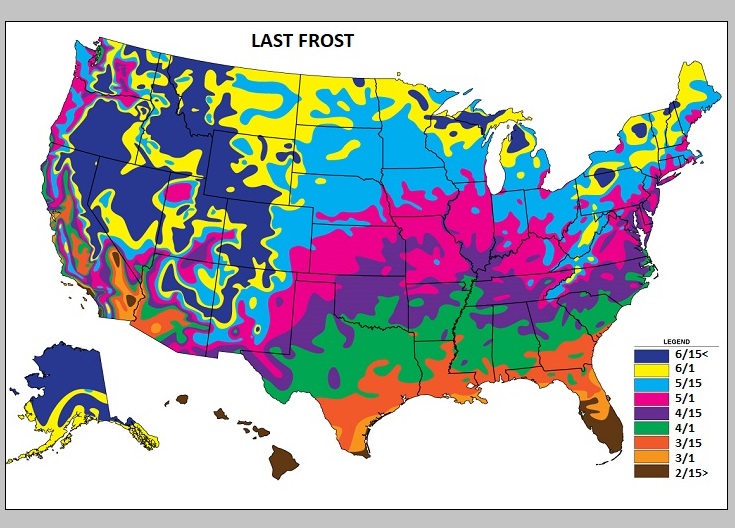
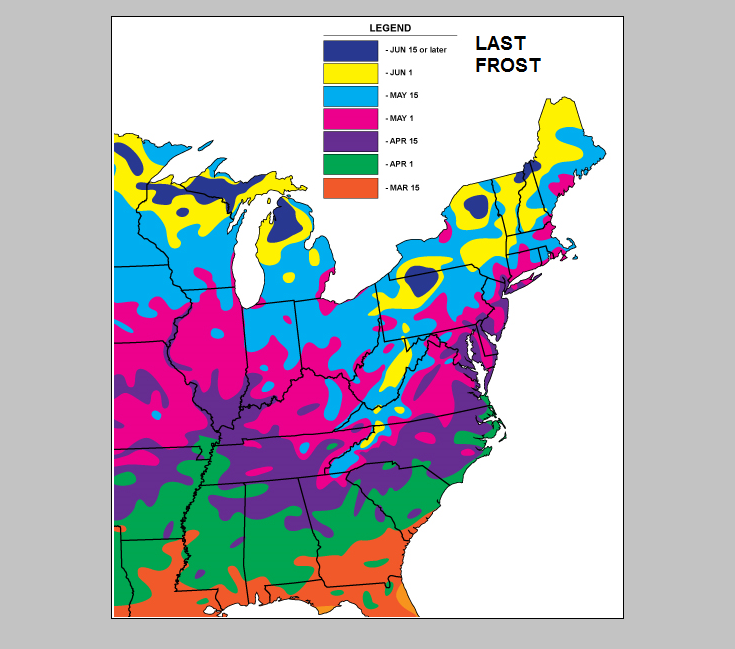
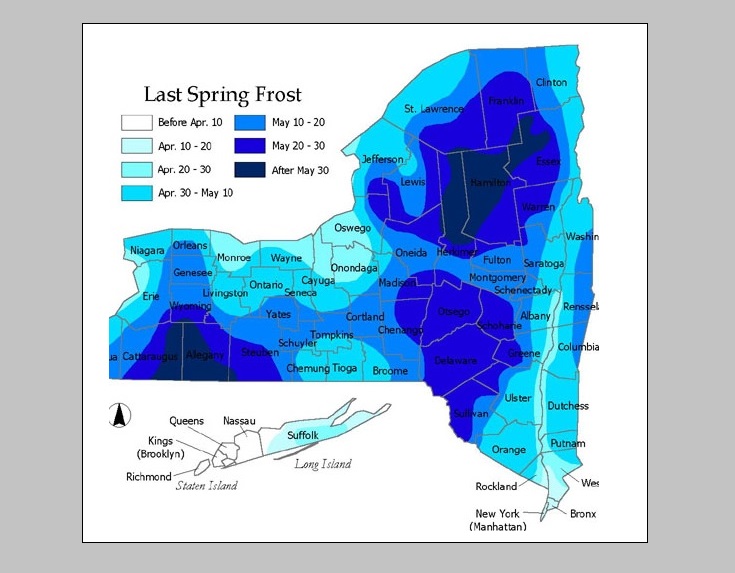
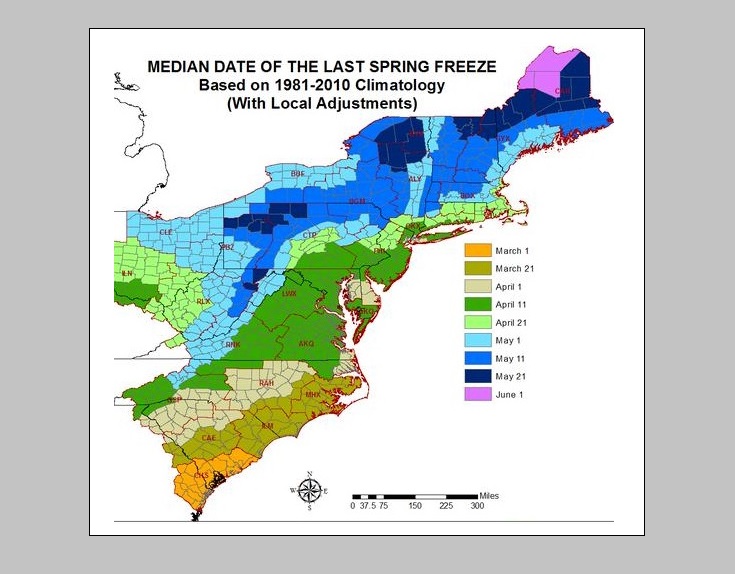
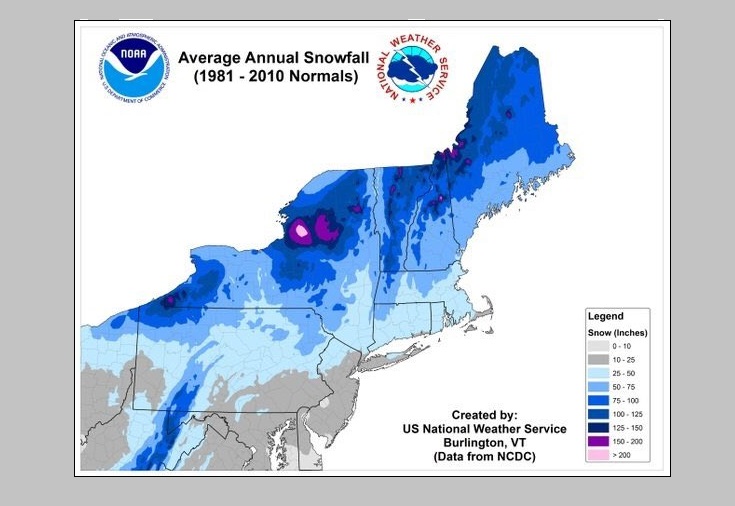
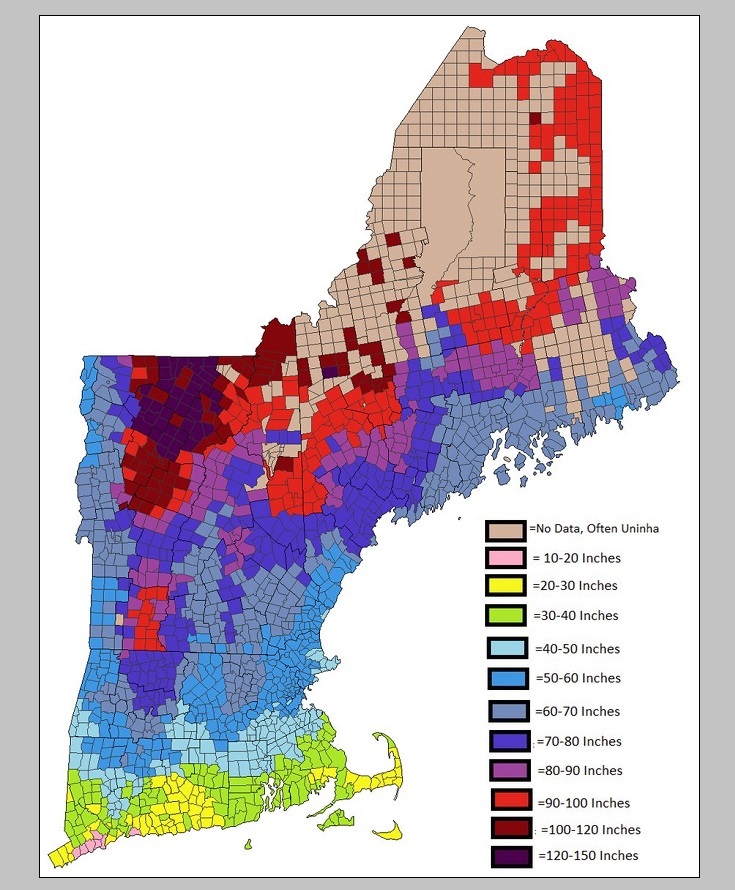
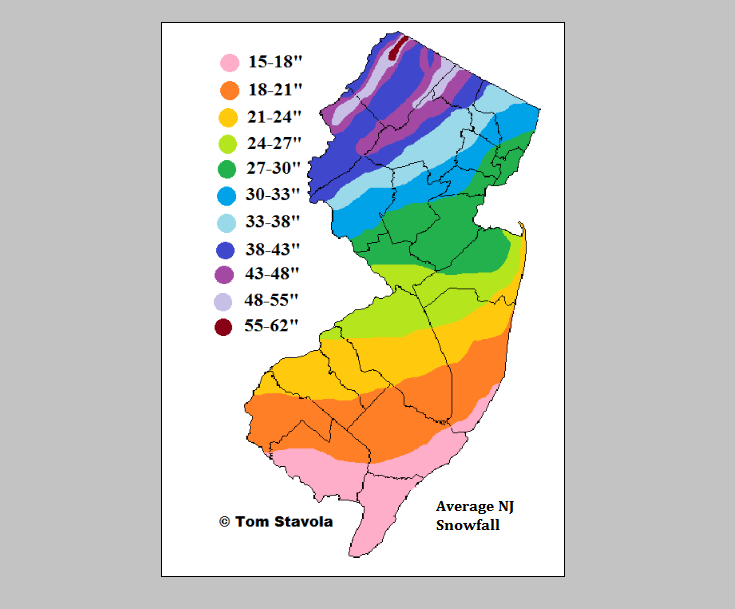
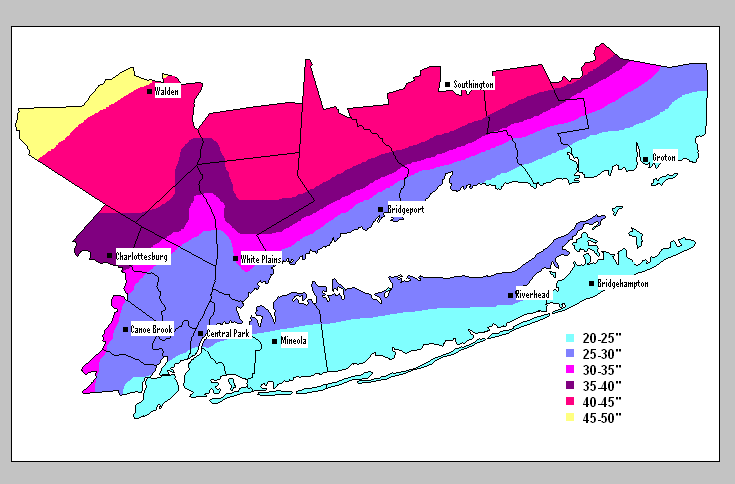
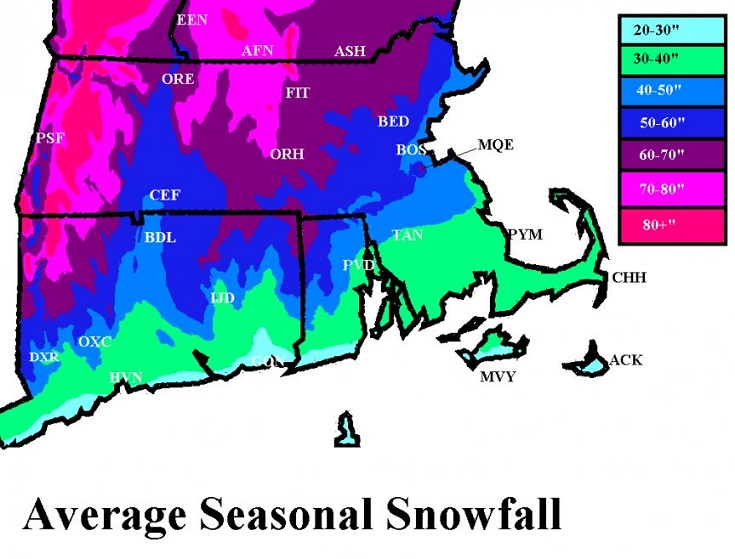
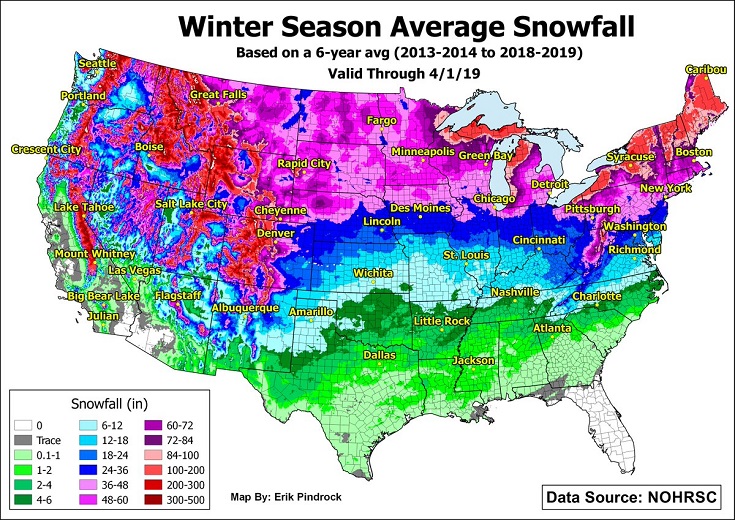
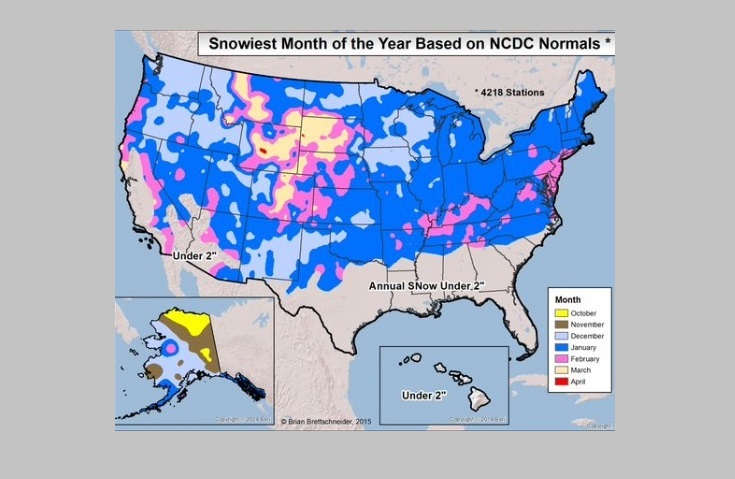
Snowfall Averages 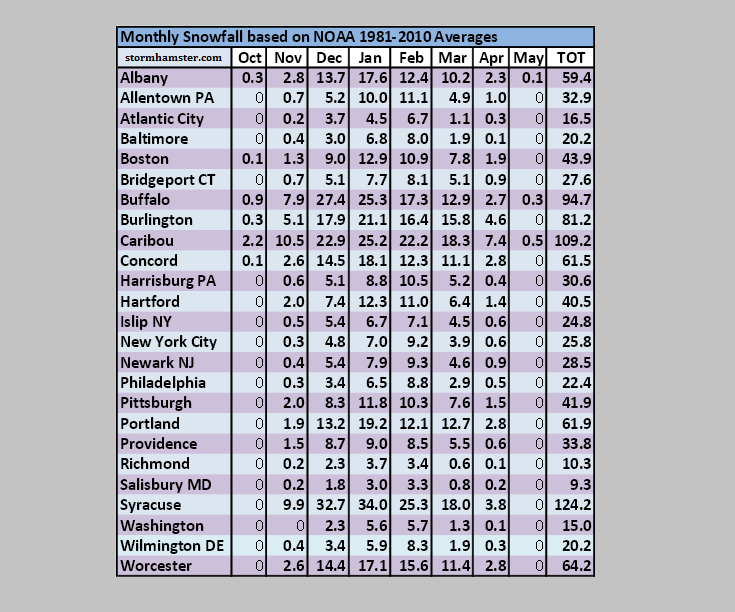
Monthly Snowfall Averages. Developed in 2017 as per the NOAA 1981-2010 baseline average. 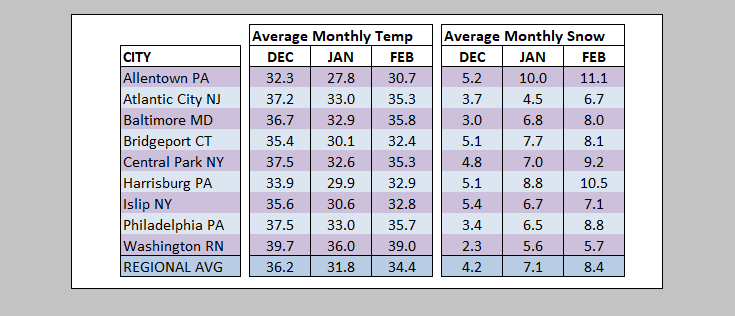
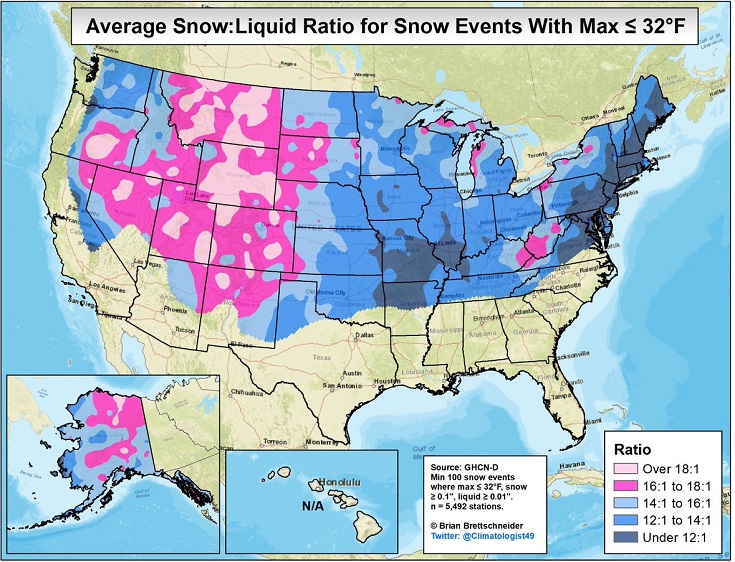
Monthly Averages. Developed in 2017 as per the NOAA 1981-2010 baseline average. Approximate snowfall amounts at specified temperature ranges. Melt Water Equivalent Temperature (degrees F) (inches) 34 to 28 27 to 20 19 to 15 14 to 10 9 to 0 -1 to -20 -21 to -40 Trace trace 0.1 0.2 0.3 0.4 0.5 1.0 .01 0.1 0.2 0.2 0.3 0.4 0.5 1.0 .02 0.2 0.3 0.4 0.6 0.8 1.0 2.0 .03 0.3 0.5 0.6 0.9 1.2 1.5 3.0 .04 0.4 0.6 0.8 1.2 1.6 2.0 4.0 .05 0.5 0.8 1.0 1.5 2.0 2.5 5.0 .06 0.6 0.9 1.2 1.8 2.4 3.0 6.0 .07 0.7 1.1 1.4 2.1 2.8 3.5 7.0 .08 0.8 1.2 1.6 2.4 3.2 4.0 8.0 .09 0.9 1.4 1.8 2.7 3.6 4.5 9.0 .10 1.0 1.5 2.0 3.0 4.0 5.0 10.0 .11 1.1 1.7 2.2 3.3 4.4 5.5 11.0 .12 1.2 1.8 2.4 3.6 4.8 6.0 12.0 .13 1.3 2.0 2.6 3.9 5.2 6.5 13.0 .14 1.4 2.1 2.8 4.2 5.6 7.0 14.0 .15 1.5 2.3 3.0 4.5 6.0 7.5 15.0 .16 1.6 2.4 3.2 4.8 6.4 8.0 16.0 .17 1.7 2.6 3.4 5.1 6.8 8.5 17.0 .18 1.8 2.7 3.6 5.4 7.2 9.0 18.0 .19 1.9 2.9 3.8 5.7 7.6 9.5 19.0 .20 2.0 3.0 4.0 6.0 8.0 10.0 20.0 .21 2.1 3.1 4.2 6.3 8.4 10.5 21.0 .22 2.2 3.3 4.4 6.6 8.8 11.0 22.0 .23 2.3 3.4 4.6 6.9 9.2 11.5 23.0 .24 2.4 3.6 4.8 7.2 9.6 12.0 24.0 .25 2.5 3.8 5.0 7.5 10.0 12.5 25.0 .30 3.0 4.5 6.0 9.0 12.0 15.0 30.0 .35 3.5 5.3 7.0 10.5 14.0 17.5 35.0 .40 4.0 6.0 8.0 12.0 16.0 20.0 40.0 .45 4.5 6.8 9.0 13.5 18.0 22.5 45.0 .50 5.0 7.5 10.0 15.0 20.0 25.0 50.0 .60 6.0 9.0 12.0 18.0 24.0 30.0 60.0 .70 7.0 10.5 14.0 21.0 28.0 35.0 70.0 .80 8.0 12.0 16.0 24.0 32.0 40.0 80.0 .90 9.0 13.5 18.0 27.0 36.0 45.0 90.0 1.00 10.0 15.0 20.0 30.0 40.0 50.0 100.0 2.00 20.0 30.0 40.0 60.0 80.0 100.0 200.0 3.00 30.0 45.0 60.0 90.0 120.0 150.0 300.0 This table gives a statistical relationship between amounts of snow that fall and the corresponding water equivalent at specified temperature ranges. The water equivalent and snow fall amounts are listed in inches. Temperature ranges are listed in degrees Farenheit. These values are only approximate. The Actual values for a specific storm can vary significantly from this table. 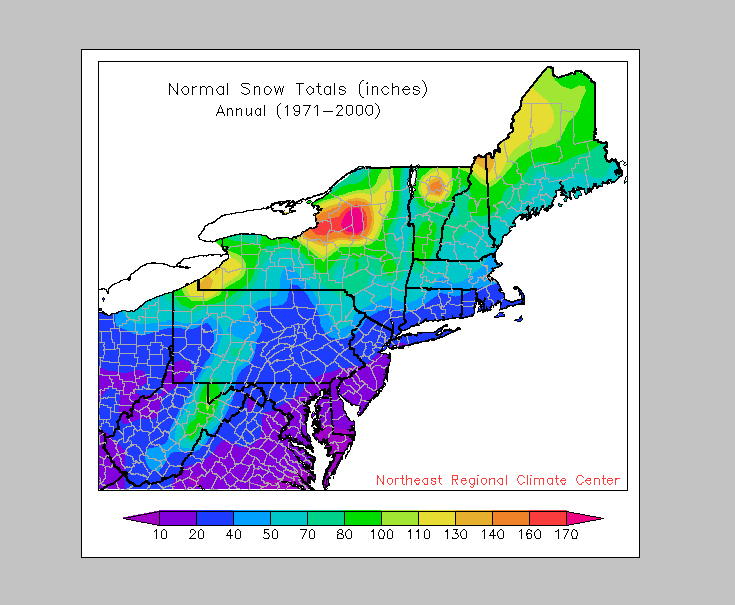
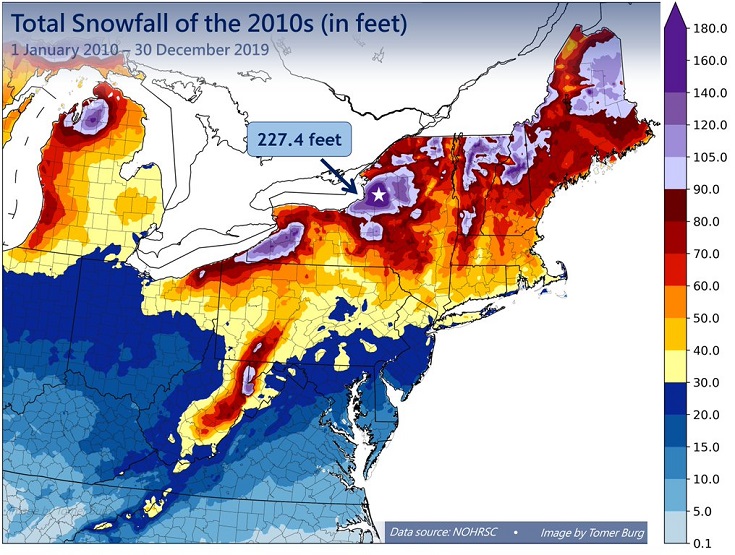
First Snows 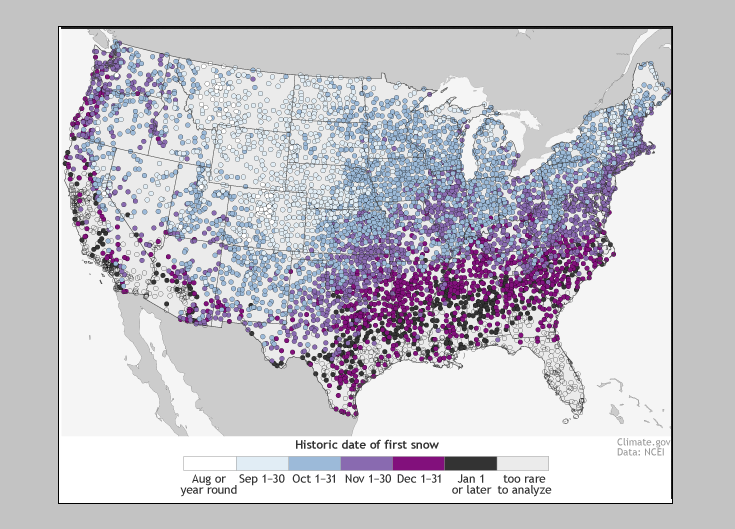
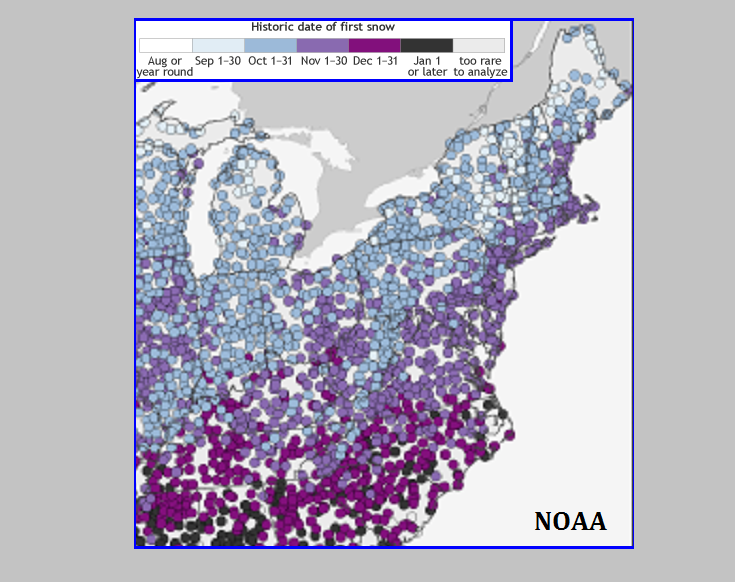
Last Snows 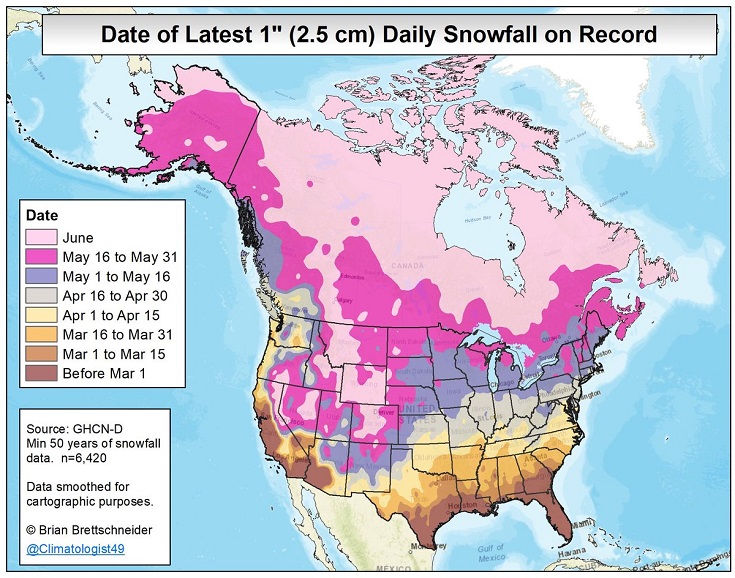
Data 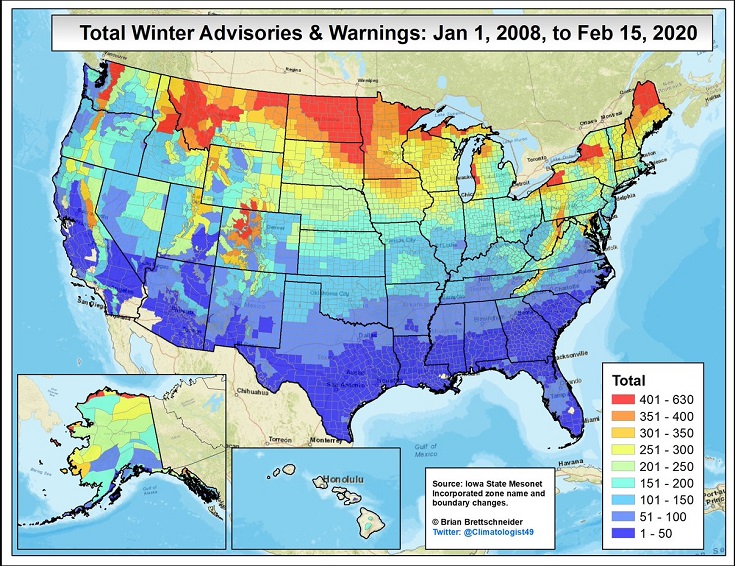
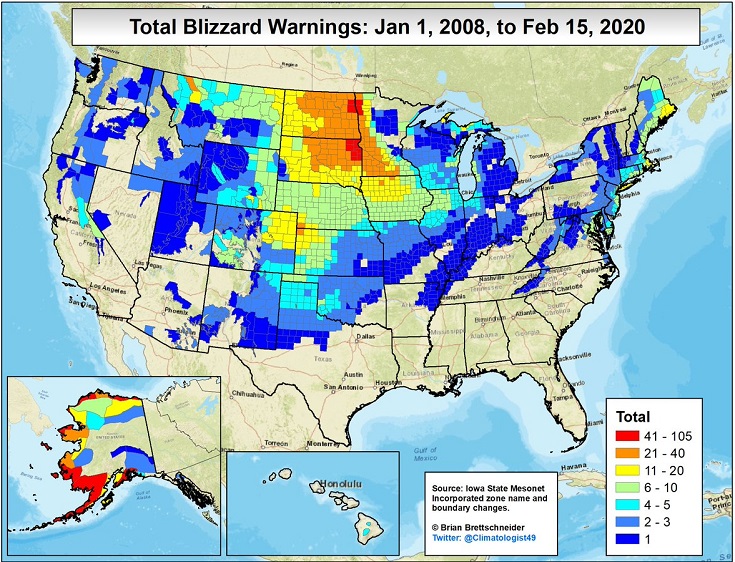
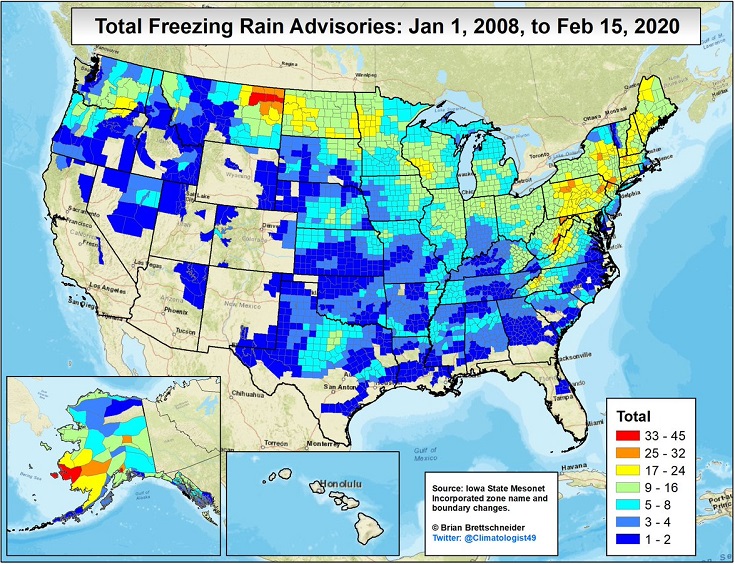
NAO 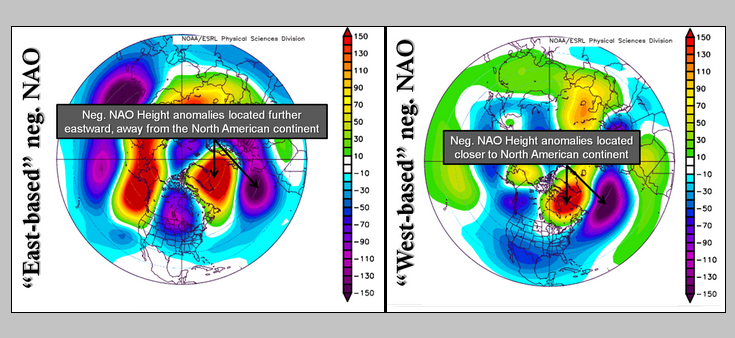
Official Information 
|